Layering of fabrics for masks
(Heavy on the science)
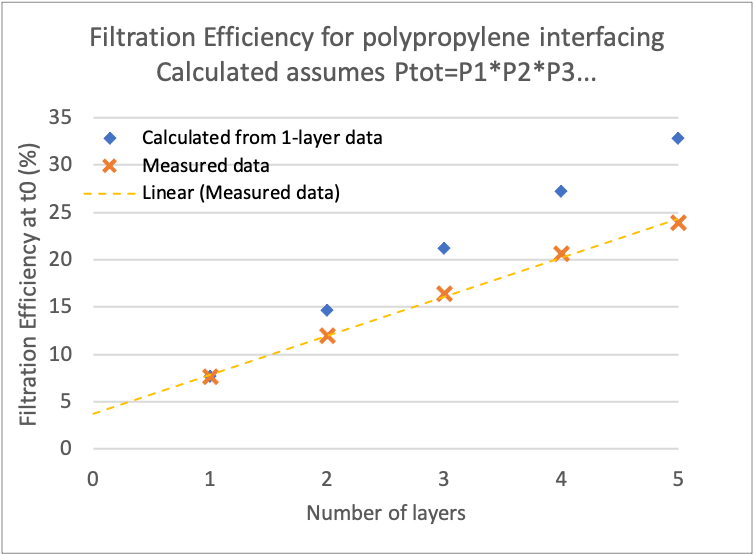
Single-layer filtration data seems insufficient to estimate filtration of multi-layer combinations. Here we go through some data suggesting that at least a one-layer and a two-layer measurement are necessary to extract penetration measurements sufficient to estimate multi-layer filtration for larger numbers of layers.

| Zhao 2020 measured filtration of 1 to 5 layers of polypropylene interfacing, which I plotted with orange Xs. If P is the penetration of a single layer, and we calculate
multi-layer filtration of N layers as:
The first layer contributes greater filtration (lower penetration) than each subsequent layer. |

| Now, assume that the first layer has a unique penetration
P1 while each subsequent layer has a penetration P.
Plot the data on a semi-log plot, fit a line, and calculate
P and P1.
Estimate filtration from:
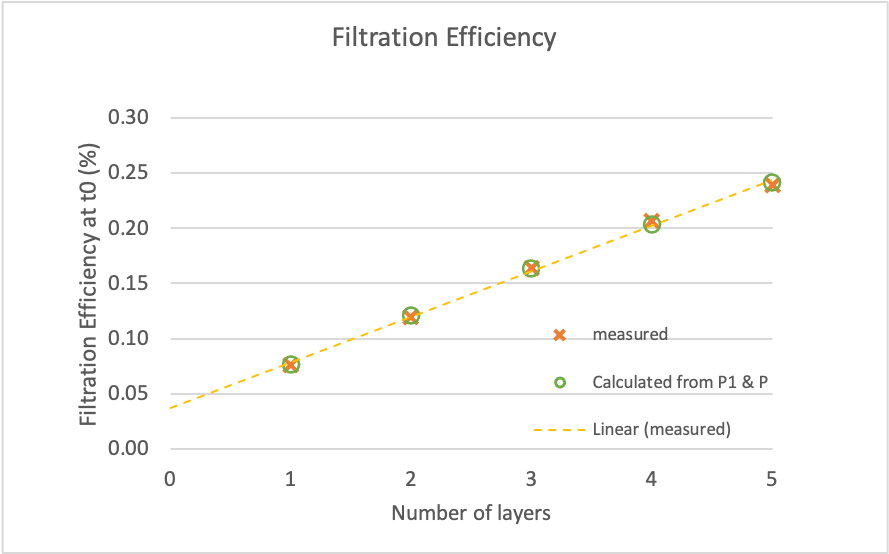
Ptot = P1 × P(N-1) Plot again Zhao's data in orange Xs and our newly estimated FE=1-Ptot in green circles. They match beautifully. My analysis (spreadsheet): Zhao-Mitros_SI_analysis.xlsx |

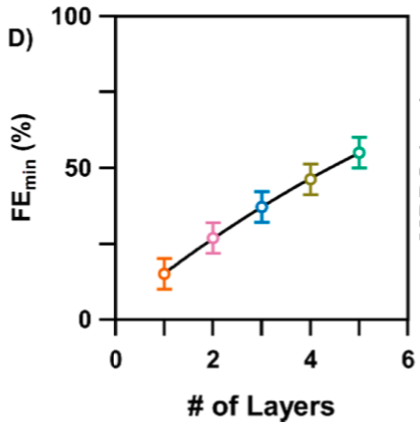
| Zangmeister 2020 has a similar looking figure for filtration of a cotton fiber poplin weave in a lightweight flannel. The points fall in a neat line, but if we extrapolate the line does not cross the y-axis at zero. The first layer provides greater filtration than each subsequent layer. |

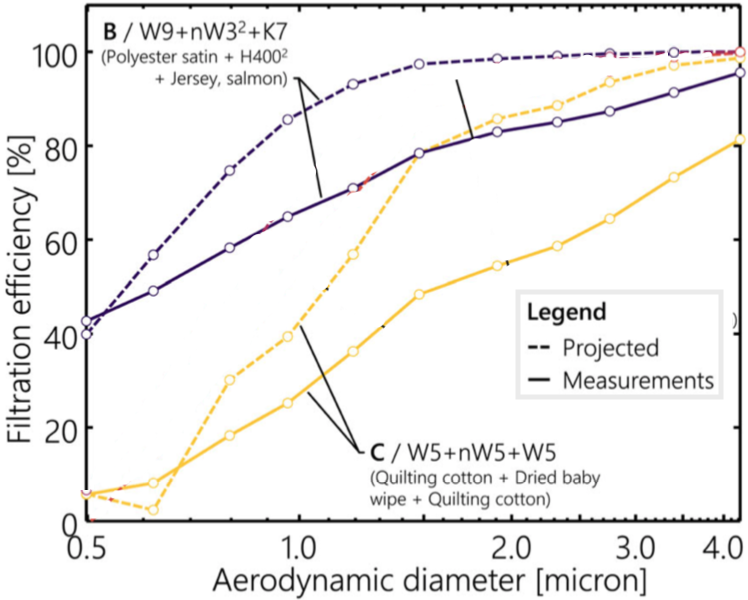
| Rogak 2020 measured filtration efficiency over a range of particle sizes. For two multi-layer sets where he showed both measured filtration and a projection based on single-layer data, the projected multi-layer filtration exceeded the measured results. Interestingly, the difference between the two varied with particle size. |
For the construction of multi-layer masks, then, it would be worthwhile to collect more data with both single-layer and multi-layer samples, to provide sufficient data to extract both first layer penetration P1 and subsequent layer penetration P values for several fabrics of interest.
References
- Steven N. Rogak, Timothy A. Sipkens, Mark Guan, Hamed Nikookar, Daniela Vargas Figueroa and Jing Wang
"Properties of materials considered for improvised masks"
Aerosol Science and Technology
Published online: 28 Dec 2020
doi.org/10.1080/02786826.2020.1855321 - Mervin Zhao, Lei Liao, Wang Xiao, Xuanze Yu, Haotian Wang, Qiqi Wang, Ying Ling Lin, F. Selcen Kilinc-Balci, Amy Price, Larry Chu, May C. Chu, Steven Chu, and Yi Cui
"Household Materials Selection for Homemade Cloth Face Coverings and Their Filtration Efficiency Enhancement with Triboelectric Charging"
Nano Lett. 2020, 20, 7, 5544–5552
Publication Date: June 2, 2020
https://doi.org/10.1021/acs.nanolett.0c02211 - Christopher D. Zangmeister, James G. Radney, Edward P. Vicenzi, and Jamie L. Weaver
"Filtration Efficiencies of Nanoscale Aerosol by Cloth Mask Materials Used to Slow the Spread of SARS-CoV-2"
ACS Nano 2020, 14, 7, 9188–9200
Publication Date:June 25, 2020
https://doi.org/10.1021/acsnano.0c05025
Back to Ania's Home Page